Optra AI - Interactive Dashboard
AI powered system that helps manufacturing supervisors monitor machine performance in real time and assign the right workers to the right tasks for smoother, more efficient plant operations.
Role
UX/UI Designer
Industry
Manufacturing & Machineries
Duration
3 months

Research Insights
To begin with, for the given problem, trying to understand the underlying problems faced by manufacturing supervisors was key. I conducted in-depth research into current factory floor workflows, decision-making challenges, and the cognitive load associated with multitasking in industrial environments. Below are the results of my findings.
Understanding the Problem:
As data-driven decision-making becomes increasingly essential to business success, manufacturers are under pressure to harness real-time operational insights for continuous improvement. AI-integrated systems present a compelling solution, enabling better-informed decisions through intelligent automation and predictive analytics.
One promising design approach is personalisation or adaptation, where the system learns from individual users and incrementally tailors its interface and interactions. This human–AI collaboration empowers supervisors to make nuanced decisions while leveraging the system’s analytical capabilities.
To optimize usability in dynamic factory environments, especially for floor supervisors, a hands-free interface such as a head-mounted display (HMD) or an optical see-through device becomes a key component of the solution. These devices enable real-time contextual data to be overlaid on the user’s field of vision, allowing for quick action without disrupting ongoing tasks. However, the interaction design must also account for ambient challenges for instance, noisy industrial settings that may compromise voice assistant reliability. A balanced approach that combines visual, tactile, and possibly gesture-based controls alongside voice interaction is crucial to ensure seamless and adaptive user experiences. The system should empower supervisors by providing clarity, control, and confidence in both routine and high-stakes scenarios.
Problem Definition:
AI-integrated system for manufacturing supervisors to efficiently track the functioning of machines and ensure the smooth operation of the plant by assigning workers to jobs based on their expertise to maximise efficiency.
Market Research
With the advent of Industry 4.0, manufacturers are increasingly adopting smart technologies that enable them to track and measure every process across the production floor. Among these technologies, manufacturing dashboards have emerged as vital tools in modern operations management. These visual dashboards offer real-time insights into assembly line performance, resource utilization, machine health, production quality, and workflow efficiency.
For supervisors and managers, these dashboards are not just informative; they are actionable decision-support tools. They provide a consolidated view of operations that helps in quick prioritization, proactive problem-solving, and strategic planning. This real-time visibility supports agile decision-making and encourages a culture of continuous improvement on the shop floor.
As wearable interfaces and immersive technologies evolve, the next step in dashboard innovation lies in contextual, spatial, and adaptive visualizations delivered through AR-enabled headsets or smart glasses, transforming static dashboards into live, situational awareness tools that move with the user.
By integrating AI into a wearable interface, I aim to deliver hands-free, real-time operational insights, predictive alerts, and intelligent worker assignment based on skill mapping. This solution addresses key usability needs such as minimal disruption, intuitive interaction in noisy environments, and rapid decision support, ultimately enhancing plant efficiency, safety, and responsiveness.
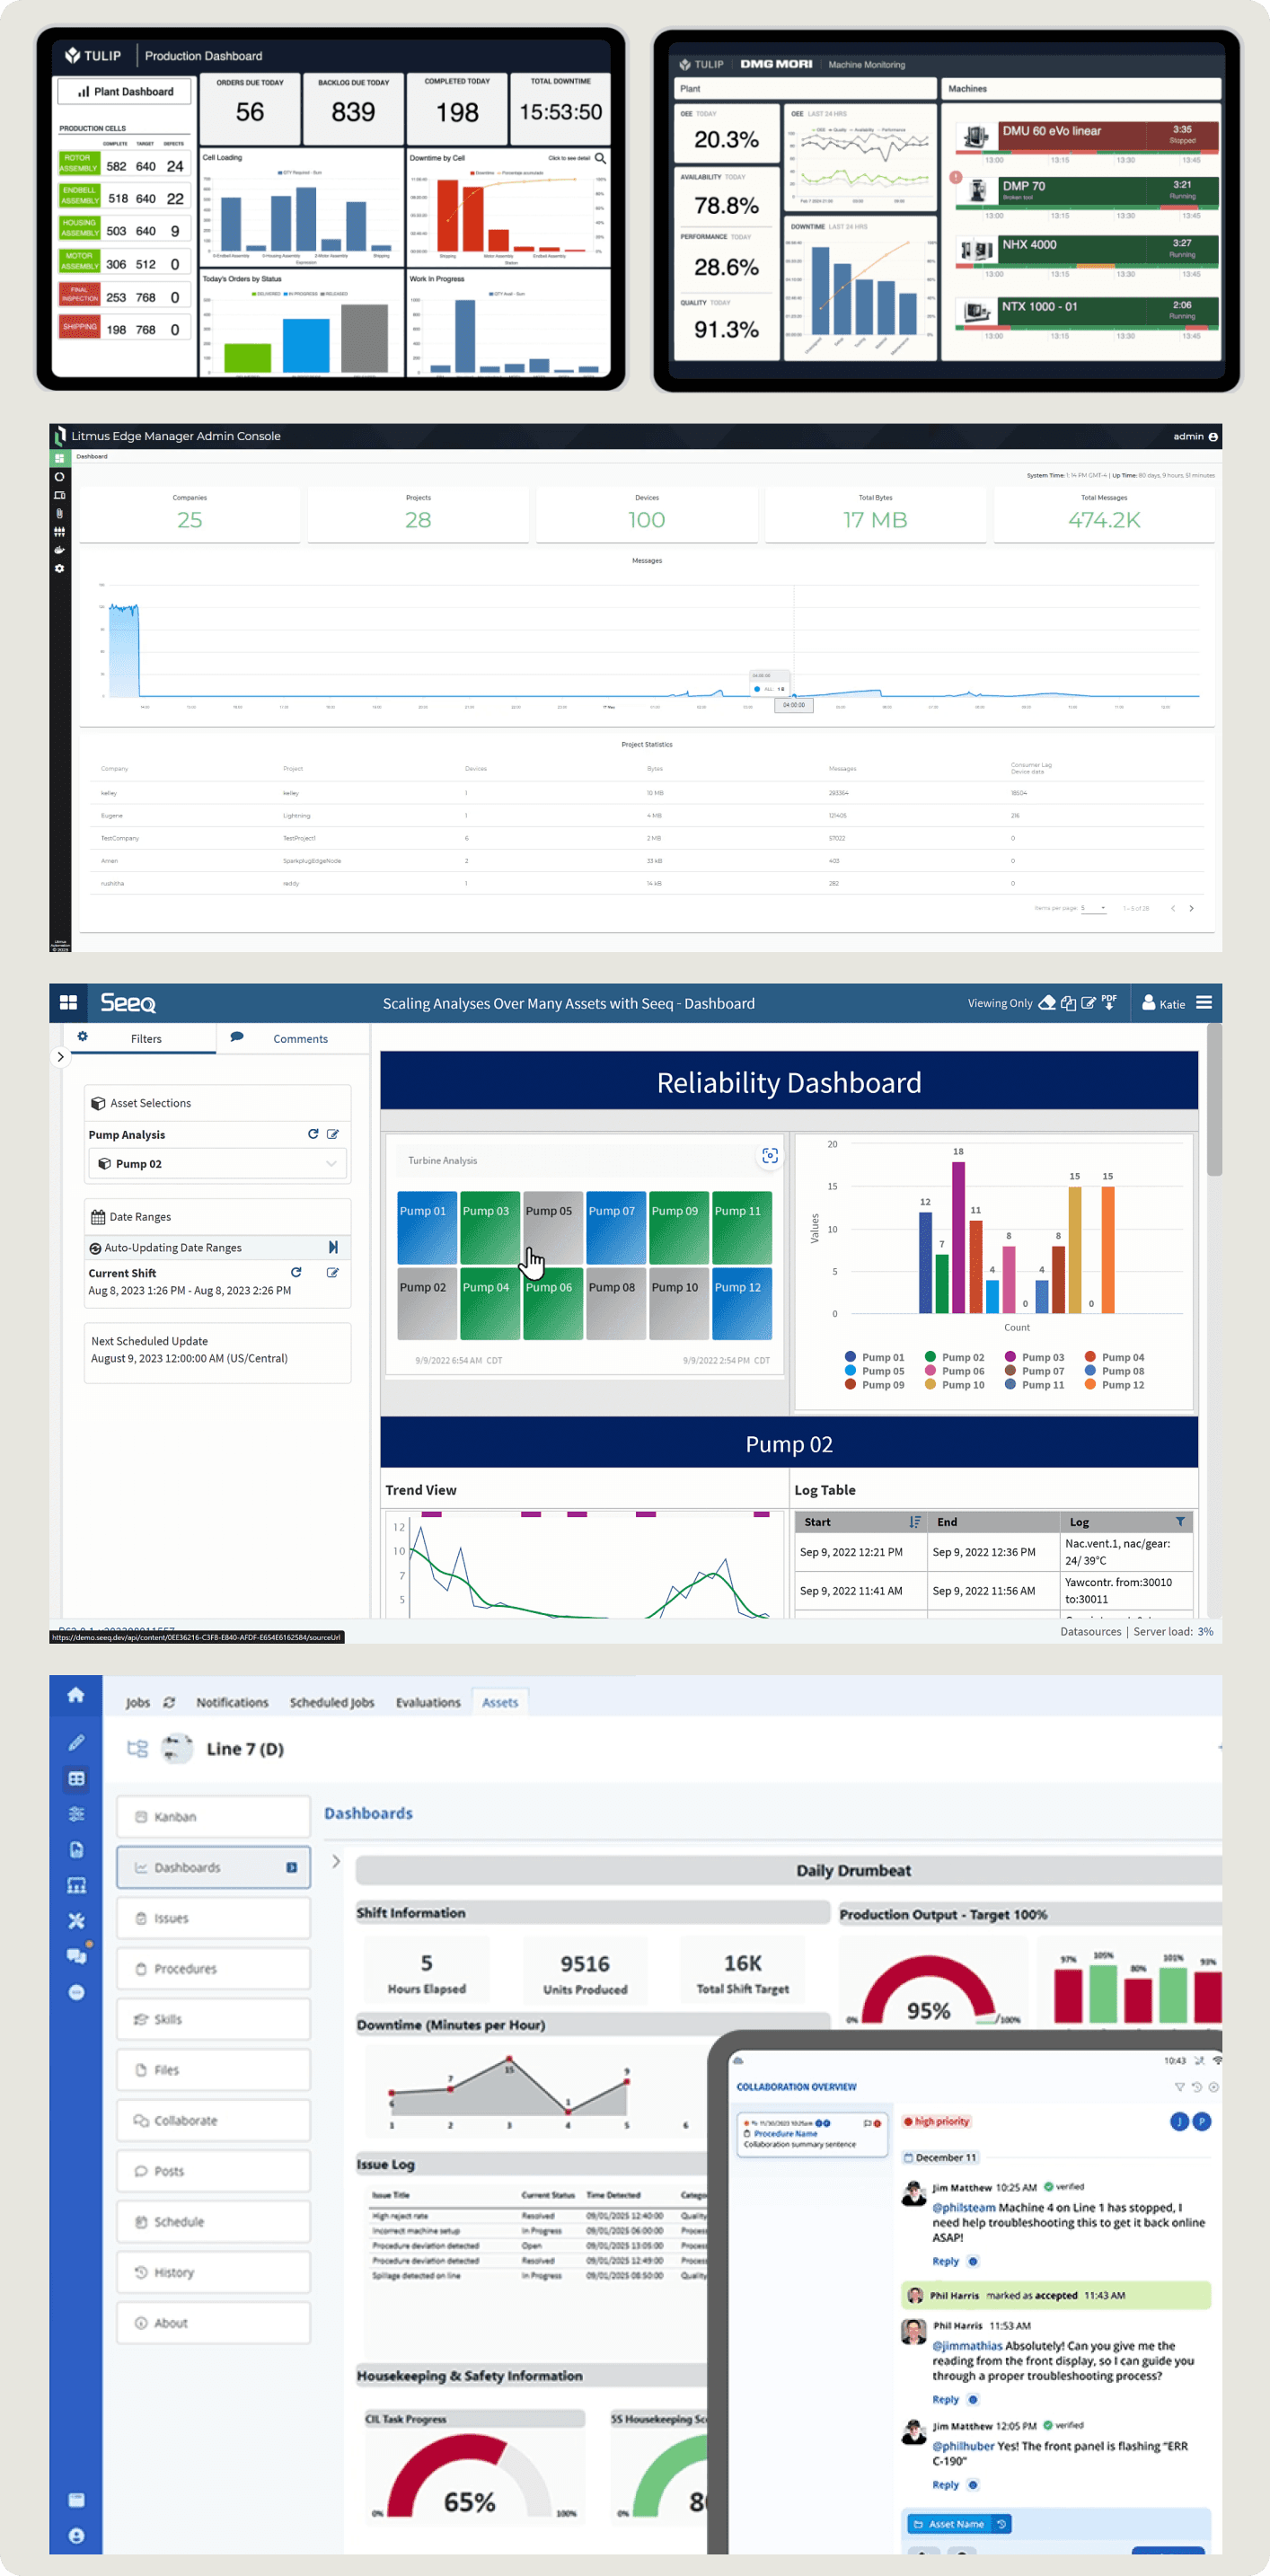
The landscape of AI-enabled manufacturing platforms is expanding rapidly. Solutions like Augmentir and Seeq lead with strong native AI capabilities, while platforms like Tulip offer modular, integration-based flexibility. The right choice depends on the level of AI maturity, integration needs, and focus on operator vs machine-level insight.
Design Strategy
In this phase of design, complex research insights were processed into actionable design decisions. It begins with defining clear design principles such as clarity, minimal cognitive load, and hands-free usability that guide all experience decisions.
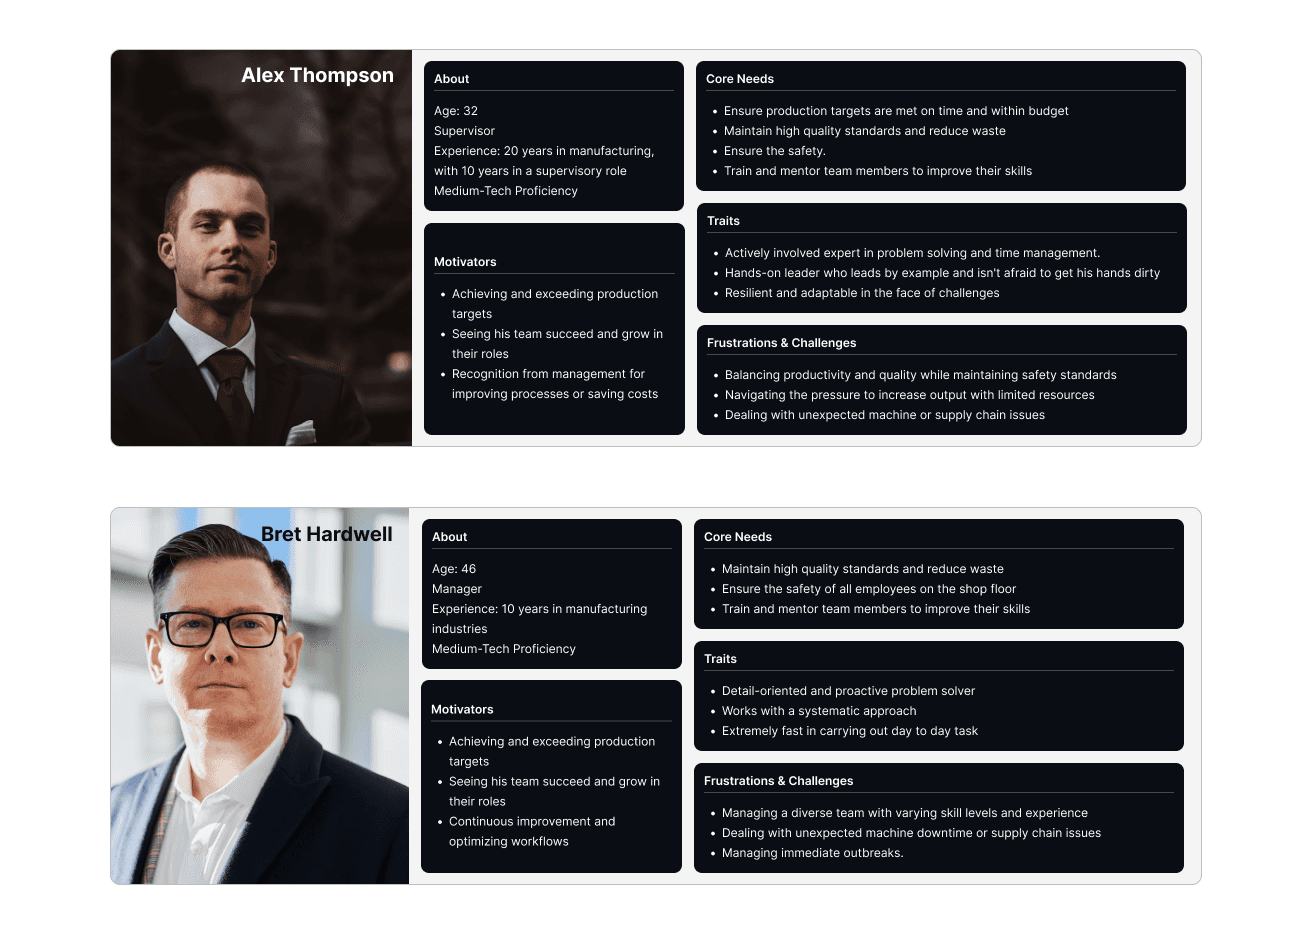
User Persona
User personas are refined to reflect the specific needs and context of manufacturing supervisors, including their environment, tasks, and pain points.
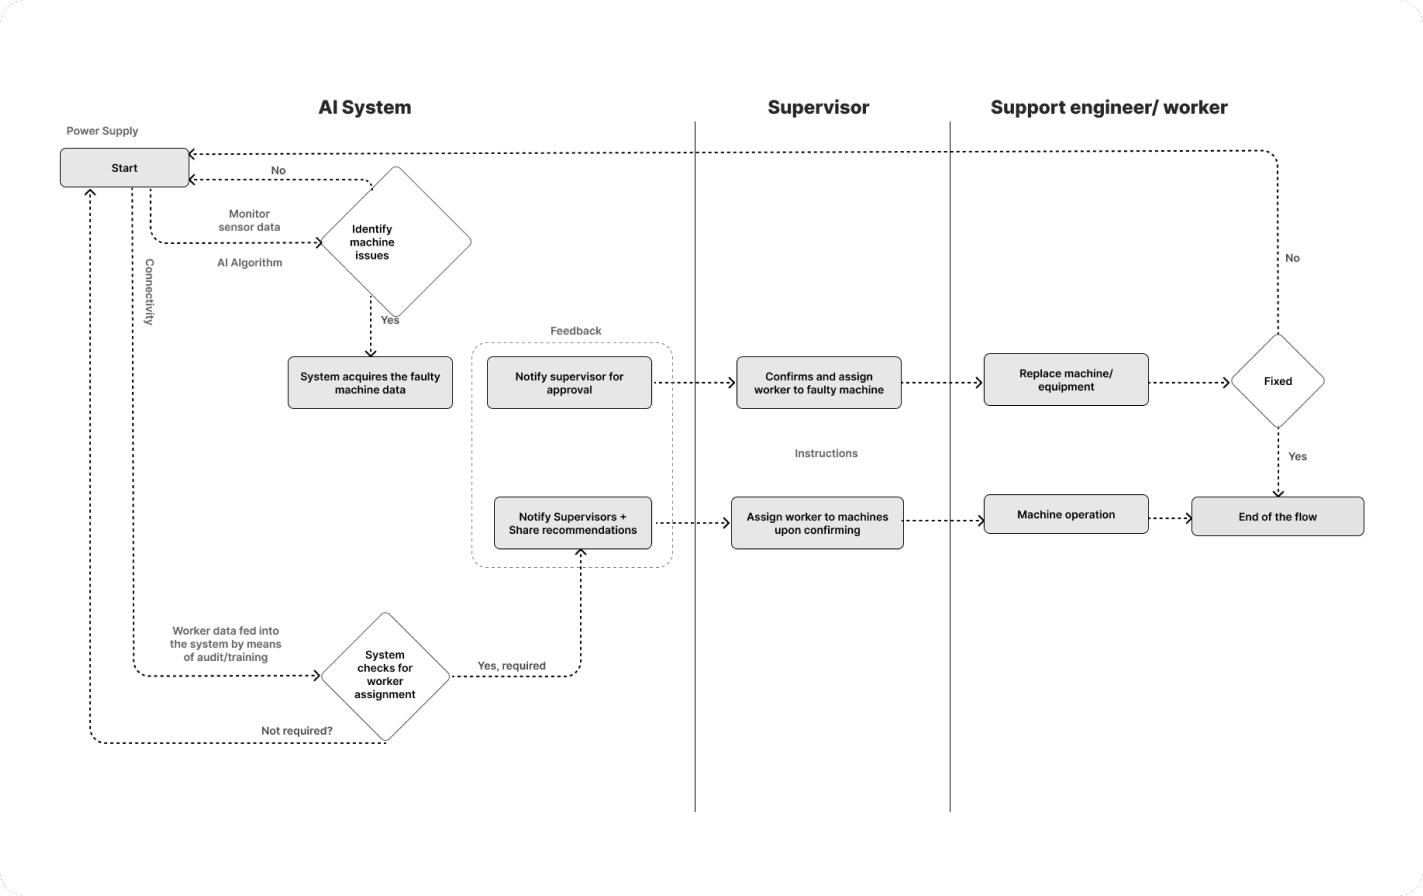
Customer Journey Mapping
A detailed customer journey map is created to outline critical workflows and highlight where AI assistance can enhance decision-making. The system mapping I followed is a process diagram that helped me comprehend, visualize, and analyze the components, relationships, and dynamics within this complex system. Whether it's dealing with complex organizational structures, AI systems mapping helps us make sense of the interconnected elements that contribute to the overall behavior and performance of the system.
Stage | User Actions | Touchpoints | Pain Points | Opportunities |
|---|---|---|---|---|
Log In + Set up | Supervisor logs in and selects their role | Biometric login, login prompt | Authentication delays | Optimise quick access to dashboards with biometrics |
Monitor Machines | Supervisors check machine status via VR. AI shows live updates | Dashboard, VR Progress boards, AI alerts. | Hard to detect minor efficiencies quickly | AI-powered predictive insights with an alert. Live machine updates and performance analytics. |
Worker Assignment | AI suggests an available worker. Supervisors confirm assignments. | Worker profile database, task assignment UI | Worker availability mismatch | AI multi-worker suggestion system for alternative suggestions. |
Detect & Resolve issues | AI predicts machine -> supervisor gets notified | Notifications and AI-suggested fixes | False alarms or delayed alerts | AI Confidence level indicator to validate predictions. |
AI-Powered Optimisation | Supervisor reviews report to optimise workflows | AI-generated analytics and predictive scheduling | Manual analysis is time-consuming. | Automated AI reports & proactive efficiency suggestions. |
Log out & End shift | System syncs updates/ user logs out | Exit prompt + Auto sync | Data loss due to poor syncing | Cloud-based backup & real time sync |
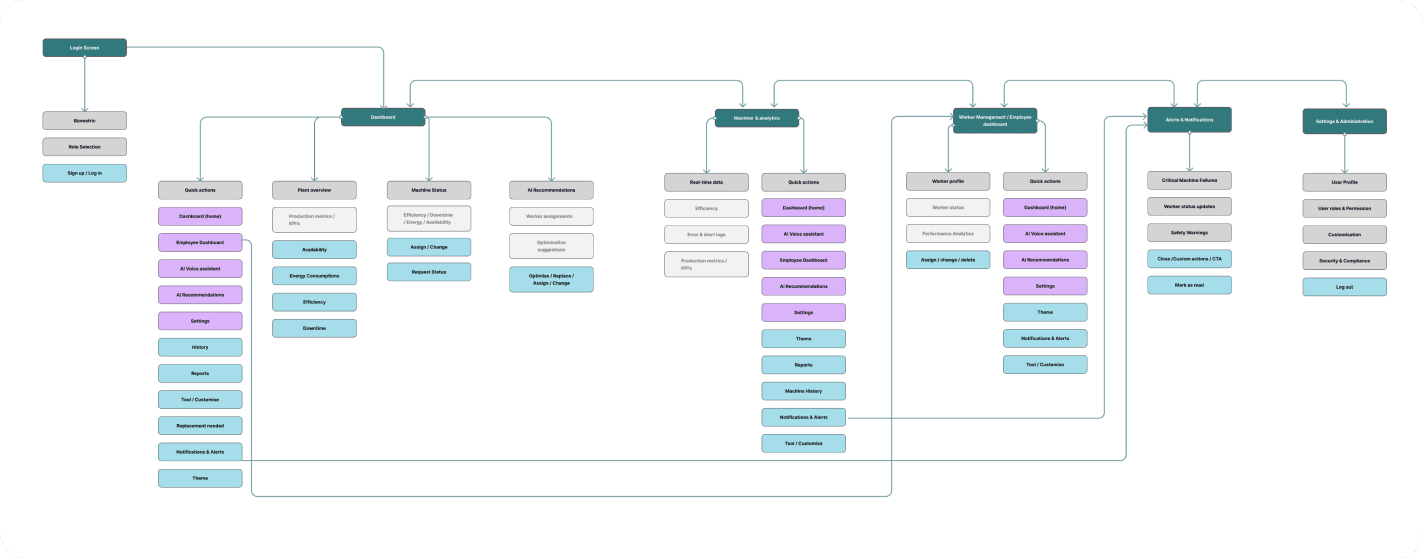
User Flows
User flows helped me comprehend, visualize, and analyze the components, relationships, and dynamics within this complex system. Whether it's dealing with complex organizational structures, AI systems mapping helps us make sense of the interconnected elements that contribute to the overall behavior and performance of the system.
Information Architecture
Information architecture is structured to prioritize essential data and ensure smooth, contextual delivery through the head-mounted display as a user navigates through the product.
Interaction Strategy Interaction
Strategies are planned around intuitive input methods like voice, eye tracking, or gestures to reduce disruption. System feedback mechanisms are designed to provide real-time alerts and confirmations in a subtle, non-intrusive manner. The strategy also includes preparing for key use scenarios and edge cases, ensuring the system responds gracefully to unexpected events.
Head mount display to supervise the functioning of the manufacturing unit and optimize its resources for more efficiency with less wastage of energy. It is achieved by monitoring the machine in real-time for any defects so it can be replaced by timely human intervention. Machine monitoring uses sensors and IoT devices coupled with predictive analysis to forecast machine failures. Worker performance and skill set data is recorded manually by the supervisors through an audit fed into the system. The human interaction with the head mount display should allow supervisors to access, manipulate, and update machine status, and worker information and also should be able to provide the users recommendations to avoid unmonitored production, production overflow, wastage of resources, and so on. Visual alerts and feedback on the AR display help them to make prompt actions for seamless production.
Machine Management: Machine monitoring to predict failures:
Utility: The automated information regarding the machines gets updated and is stored in the database directly is sent to supervisors for further analysis to make the final decisions upon confirming.
Balance: It should provide the perfect balance between automation and manual operations that needs humans intervention in the process for more efficient management.
Control: The supervisors should have control on accessing the machine-related data at times.The supervisors have control at any point in time to get any machine details and not always want to wait for automation to finish each time.
Worker Management: Identifying and assigning skilled workers to machines
Utility: Provide insights to workers' databases and skillsets to assign machine jobs.
Balance: The Interface should provide supervisors with information that they can assess, manipulate, and take action on.
Control: Supervisors to access, manipulate and update machine status, worker information. Users can also override system decisions anytime.
Production optimization: System Refinement: Real-time updates on machine status and recommendations to manage worker schedules, and optimize production capabilities. This increases the utility by giving users more control over critical decisions.
Human AI teaming Issues:
Human-AI teaming in AR-integrated head-mounted displays offers immense potential for enhancing productivity, safety, and decision-making in this context for manufacturing unit.
However, there could be some challenges associated with it like more cognitive load to the users, trust issues with AI, communication between the human and AI, usability, situational awareness, privacy, adaptability, workflow integration, and performance is essential to realising the full benefits of this technology. Carefully designed, user-centred development, and continuous evaluation of the system are key to overcoming these challenges and ensuring effective human-AI collaboration.
Ensuring Alignment:
Finding a perfect balance between automated operations can ensure alignment. A response system that sends timely feedback to users. As a user, he should always feel a sense of control over the automated system for better alignment which should allow supervisors to access, manipulate, and update machine status, worker information and override any recommendations/suggestions provided by the AI system.
Handling AI Updates:
The users should be informed and provided with necessary training about any AI model updates. If it requires onboarding, users should also be given training or assistance on how to employ these system changes.
Development
Following my initial learnings, wireframes and concept sketches are translated into interactive prototypes that bring the AI-integrated head-mounted display experience to life. The goal is to visualize and validate key workflows such as machine monitoring, task assignment, and real-time alerts through intuitive, context-aware layouts. Prototypes are designed to simulate real-world conditions, factoring in limited screen space, user movement, and environmental constraints on the shop floor. I tested early concepts using low- to mid-fidelity wireframes to quickly gather feedback and iterate on the design.
At the start of the prototype development stage, I considered several critical questions to guide our design decisions. First, I examined the nature of the data processed by the system recognizing that it is high-dimensional, rapidly changing, and often marked by uncertainty due to fluctuating machine performance and variable worker availability. Based on these characteristics, I explored suitable information visualization methods to help users make sense of complex data in real time. Two potential approaches were a heat map overlay and a timeline-based performance dashboard. Heat maps offer an intuitive spatial representation of machine status and worker distribution, making it easy to spot anomalies. Timeline dashboards allow detailed tracking of performance trends and job assignments over time, but risk becoming cluttered in high-velocity environments. In parallel, I addressed the challenge of automation interpretability particularly the issue of supervisors not fully understanding how the AI assigns workers or flags machine issues. This lack of transparency could lead to distrust, misinformed decisions, or even operational delays if not resolved. I plan to evaluate the success of this interpretability layer through usability testing and supervisor feedback, focusing on clarity, trust, and decision confidence during real or simulated tasks.
Nature of the data:
High-dimensional. Dimensions include machine sensor output (pressure, temperature, productivity, quality, operational) and personal data to assign skilled workers to machines which is updated (e.g. availability, worker schedules, skillset and tasks)
Machine Health Data:
Machine Learning and Predictive Analytics use historical and real-time data to predict potential failures and optimize maintenance schedules. AI and machine learning algorithms analyze sensor data to identify patterns that precede equipment failures. Predictive analytics allows for more precise maintenance, reducing unnecessary downtime and extending the lifespan of machinery. There may also be high uncertainty in predictions due to varying operational conditions and sensor inaccuracies.
Worker Availability Data:
Includes real-time updates on worker status, skills, schedules and tasks, This data is less dimensional but changes rapidly due to the dynamic nature of tasks and worker movements. There may be some uncertainty if data from various sources and information entered manually by supervisors may not be always accurate. Various data set give away machine information to predict machine failures on time for replacement. Vibration to check for any misalignments, or imbalances within machine parts, temperature data to prevent overheating of units, to ensure pressure units are within operational range, and Power consumption to check for abnormal consumption patterns. And lastly, use of sensors, cameras, and automated inspection systems to detect defects or deviations in the product quality of heating units. High-dimensional data needs to be interpreted and communicated as actionable insights to the user. There should be a definitive and transparent way to send complex information regarding machine status through timely alerts and feedback. Voice assistant and initiated commands may help the users retrieve and process information much faster to ensure efficient machine control and monitoring.
Information Visualisation Methods
Interactive Visualisation:
This allows users to explore data dynamically and change views or filters to uncover insights.
Users can interact with the visualization (e.g., clicking, hovering, filtering) to explore different aspects of the data.
Positive: Empowers users to drill down into data, customise views, and discover insights that static visuals might not reveal.
Negative: Can be complex to work with due to the data density and might as well require technical skills to operate.
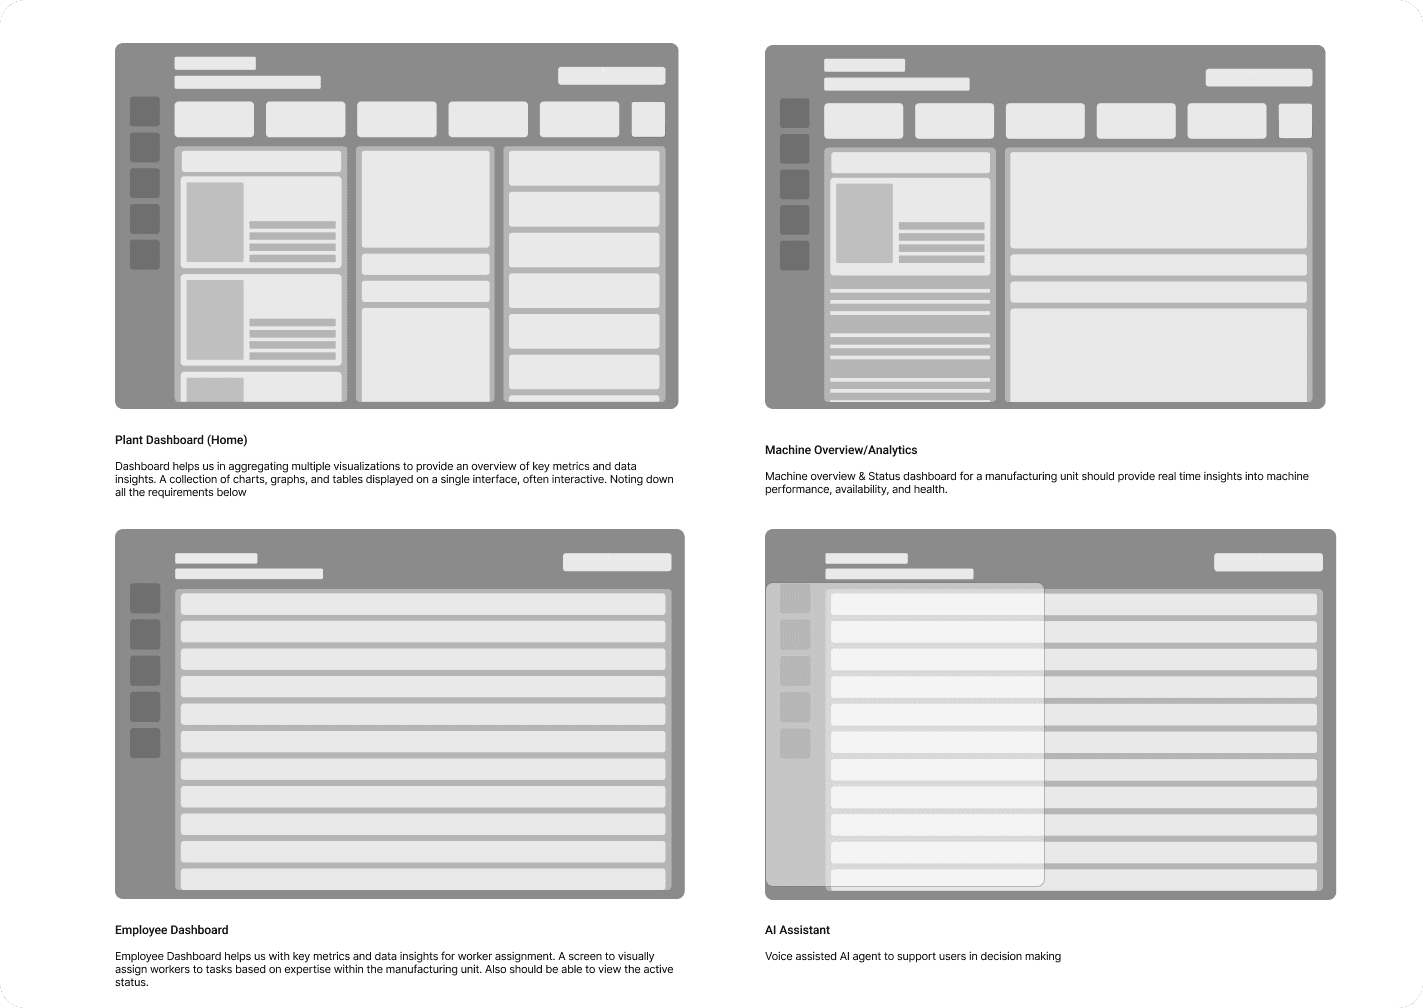
Dashboards:
We are aggregating multiple visualizations to provide an overview of key metrics and data insights. A collection of charts, graphs, and tables displayed on a single interface, often interactive.
Positive: Allows users to monitor multiple data points in real-time, providing a comprehensive view of performance or trends.
Negative: They might demand the required expertise to use them due to complex data loads and patterns.
Interpretability, problems and consequences:
Yes, the above system heavily coupled with data that are driven through automation at various stages will have interpretability issues. The system uses machine learning algorithms to analyse sensor data to identify patterns that precede equipment failures which might be difficult for users to grasp. As result they might start to overlook the operations also start losing trust in the AI system. It is very essential to provide these alerts and feedbacks in simpler formats for users to understand for them to act on. If this is unattended, this could lead to poor decision making and wastage of resources which would lead to inefficient manufacturing.
Evaluation Techniques: Methods to improve interpretability
AR glasses can provide them with directed instructions on what leads to a machine's failures, or the reasons when a machine is about to fail at normal circumstances.
- Constant surveys/feedback from the users(supervisors) can help the automated system to provide users with more informed choices and recommendations. Assessing their understanding of how the system comes up with certain decision and communicating the same back to the system will improve its functioning significantly.
Wireframing
Undertook the redesign of core app screens and user flows, addressing the audit's findings. Emphasized the creation of a more intuitive and goal-oriented user journey, reducing cognitive load and enhancing the overall user experience.
Design Execution
Designed and developed this interface with a focus on clarity, immediacy, and contextual awareness, essential for supervisors operating in fast-paced industrial environments. Adopted a functional color scheme using high-contrast, safety-compliant colors to differentiate critical alerts from routine updates, enhancing quick comprehension under varying lighting conditions.
Typography and iconography were carefully chosen for legibility and recognizability, even in motion or when viewed through a head-mounted display. Dynamic visual cues and motion principles were subtly applied to guide attention without distracting from core tasks ensuring the interface is not only visually coherent but also operationally efficient and ergonomically aligned with the realities of the factory floor.
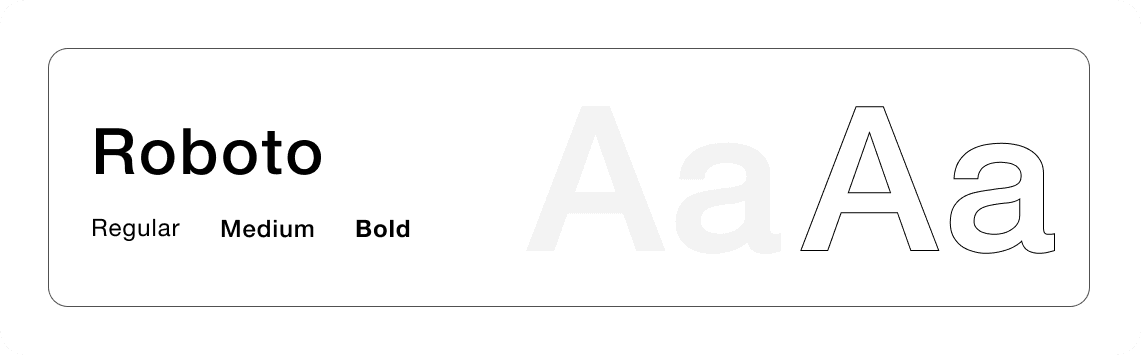
Typography
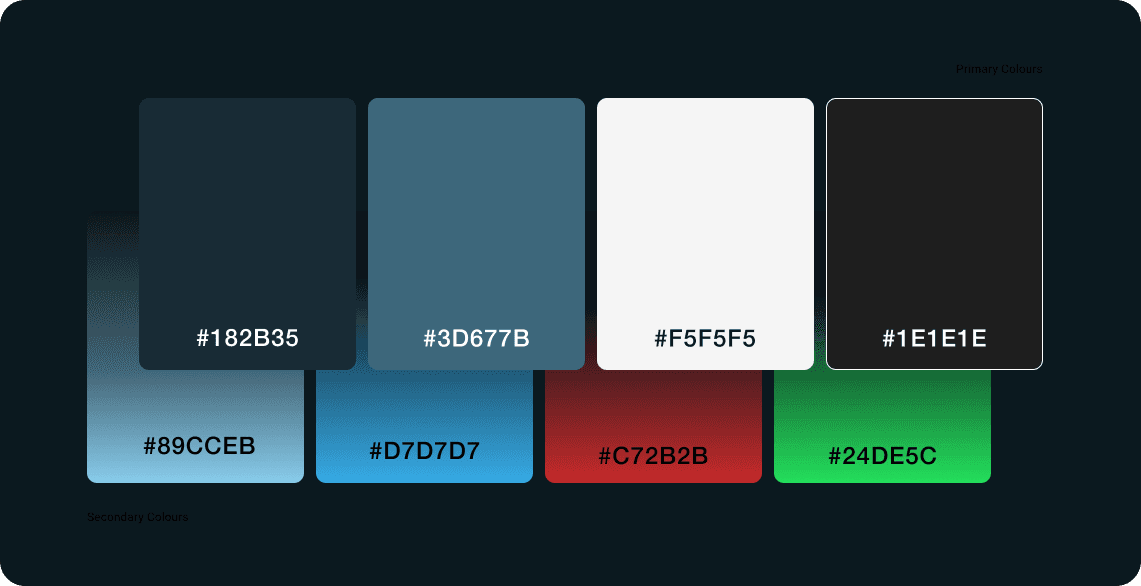
Colour
Iconography

Accessibility Consideration:
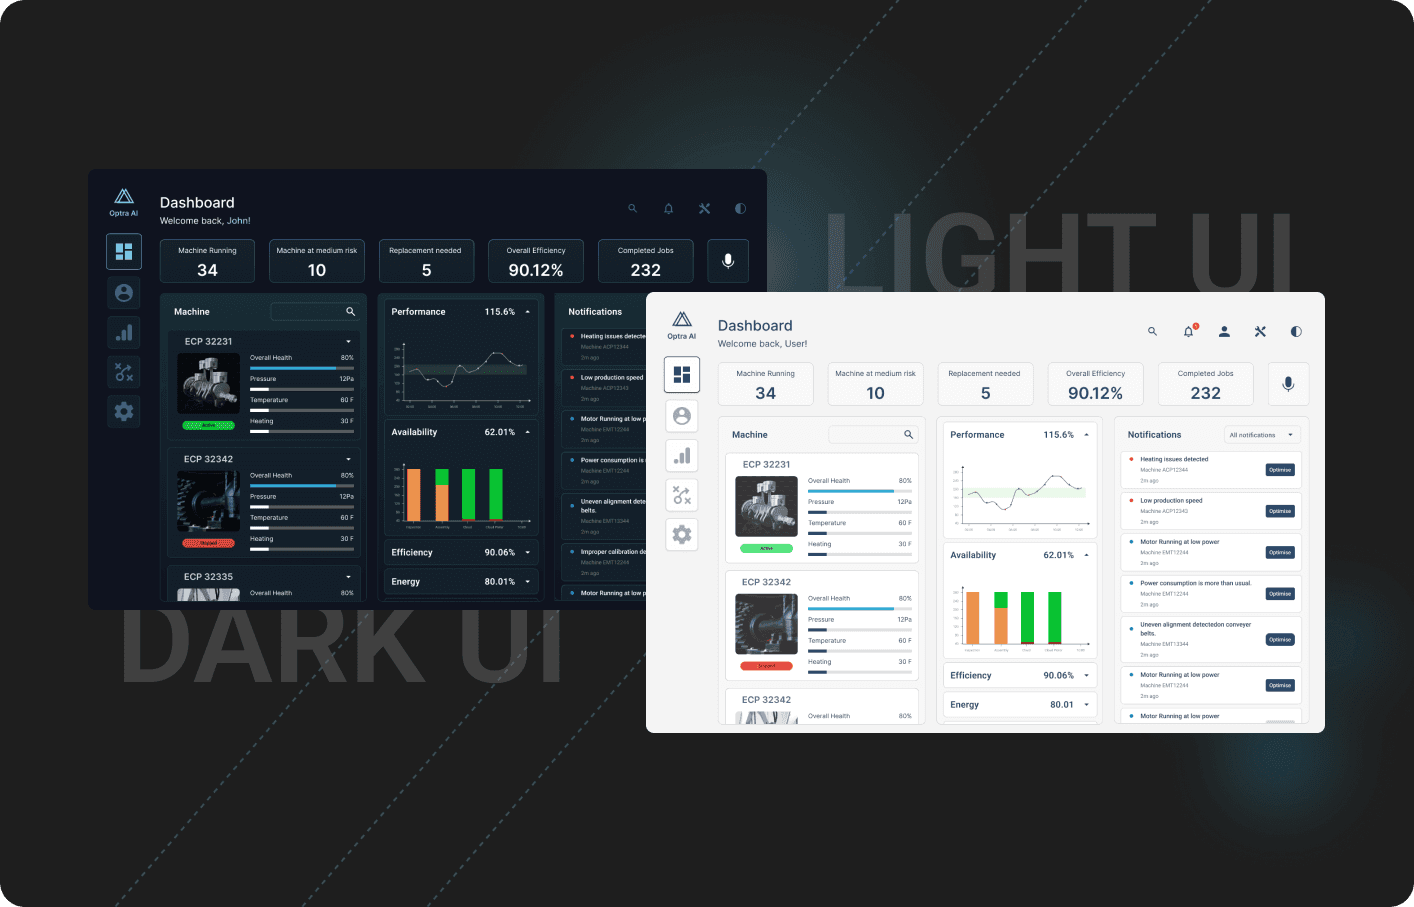
Accessibility is key to ensuring readability, usability, and visual comfort in different lighting conditions. Hence, I considered a dark/ light theme toggle for the users as it involves an enormous amount of data
Contrast and Readability
WCAG recommends 4.5: 1 contrast for body text & 3:1 for large textColour Consistency
For better readability and reduced strain used #F5F5F5 for the Light theme
For better readability and reduced strain used ##182B35 for the Dark themeIcons / UI Elements
Used a dual tone that changed based on themes
For previews/alerts, prompts used subtle shadows to feel better separations
High-fidelity Prototypes
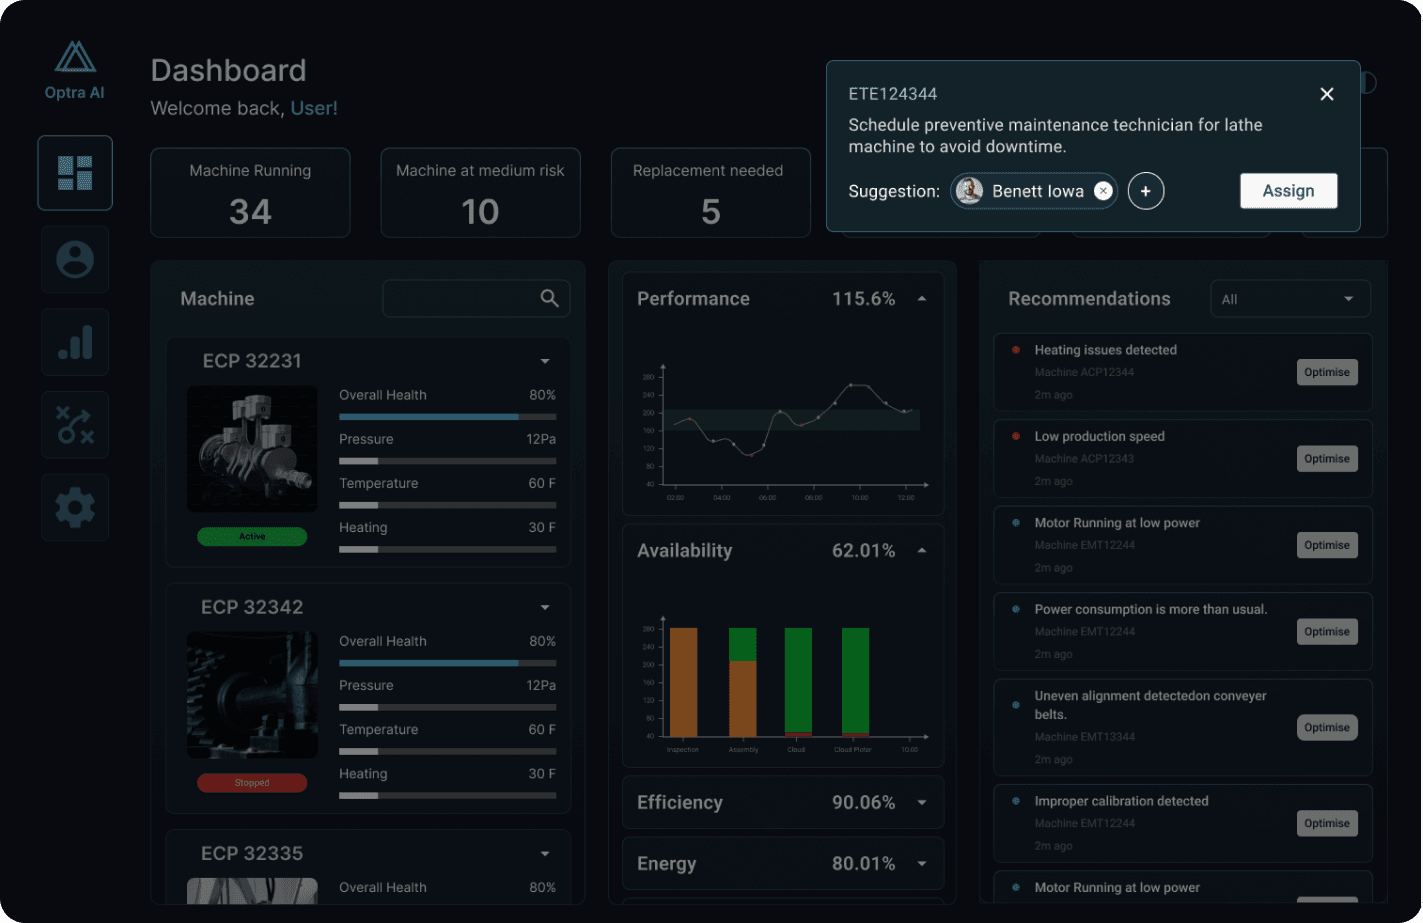
Developed high-fidelity prototypes in Figma to simulate the interactive experience of the AI-integrated system within a manufacturing environment. The prototypes were designed with a clean, data-focused interface, optimized for hands-free, glanceable interaction on head-mounted displays.
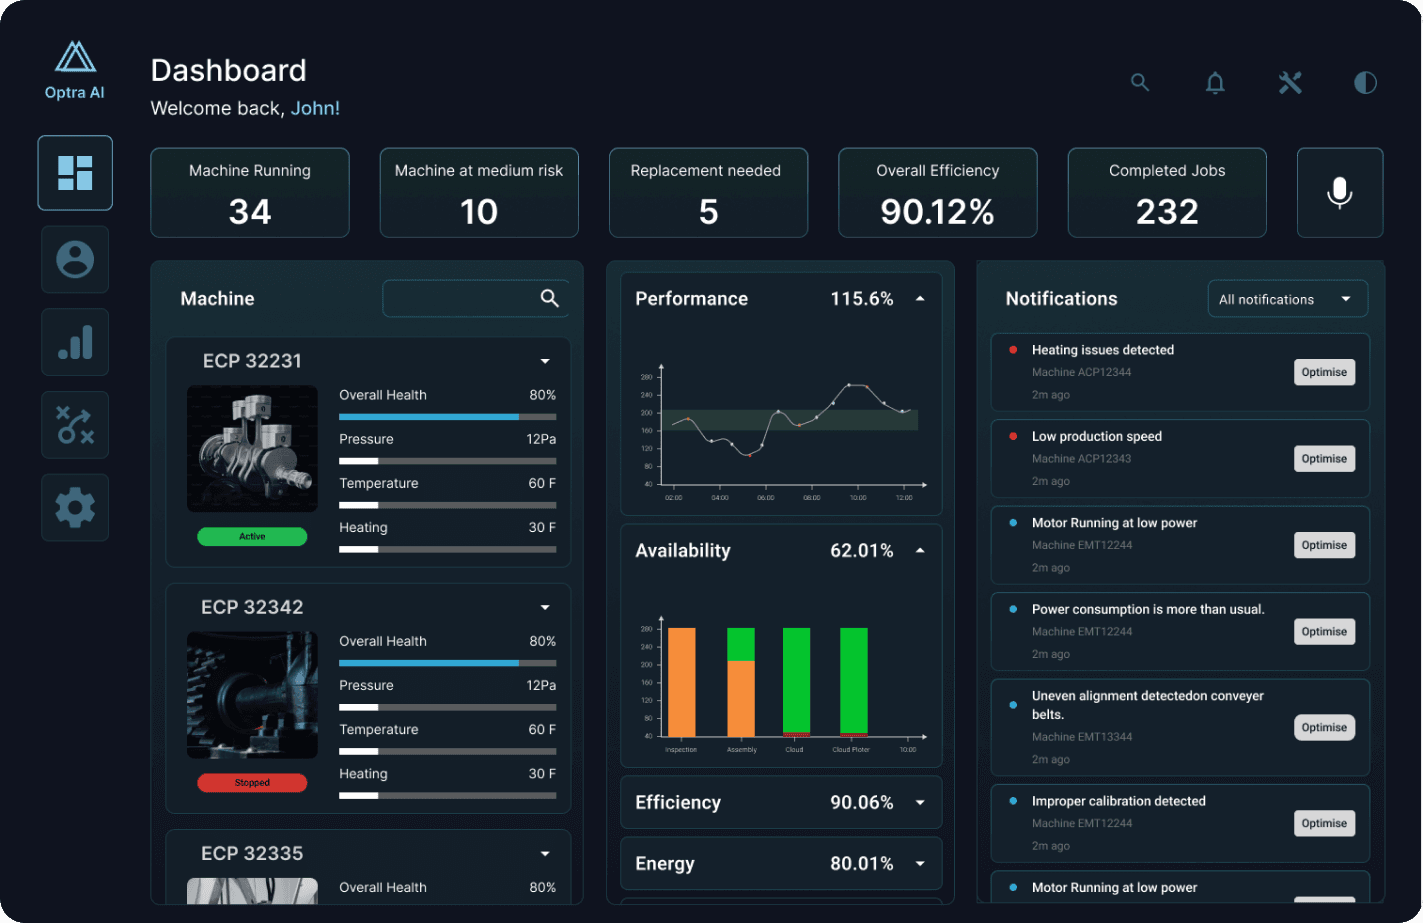
Plant Dashboard
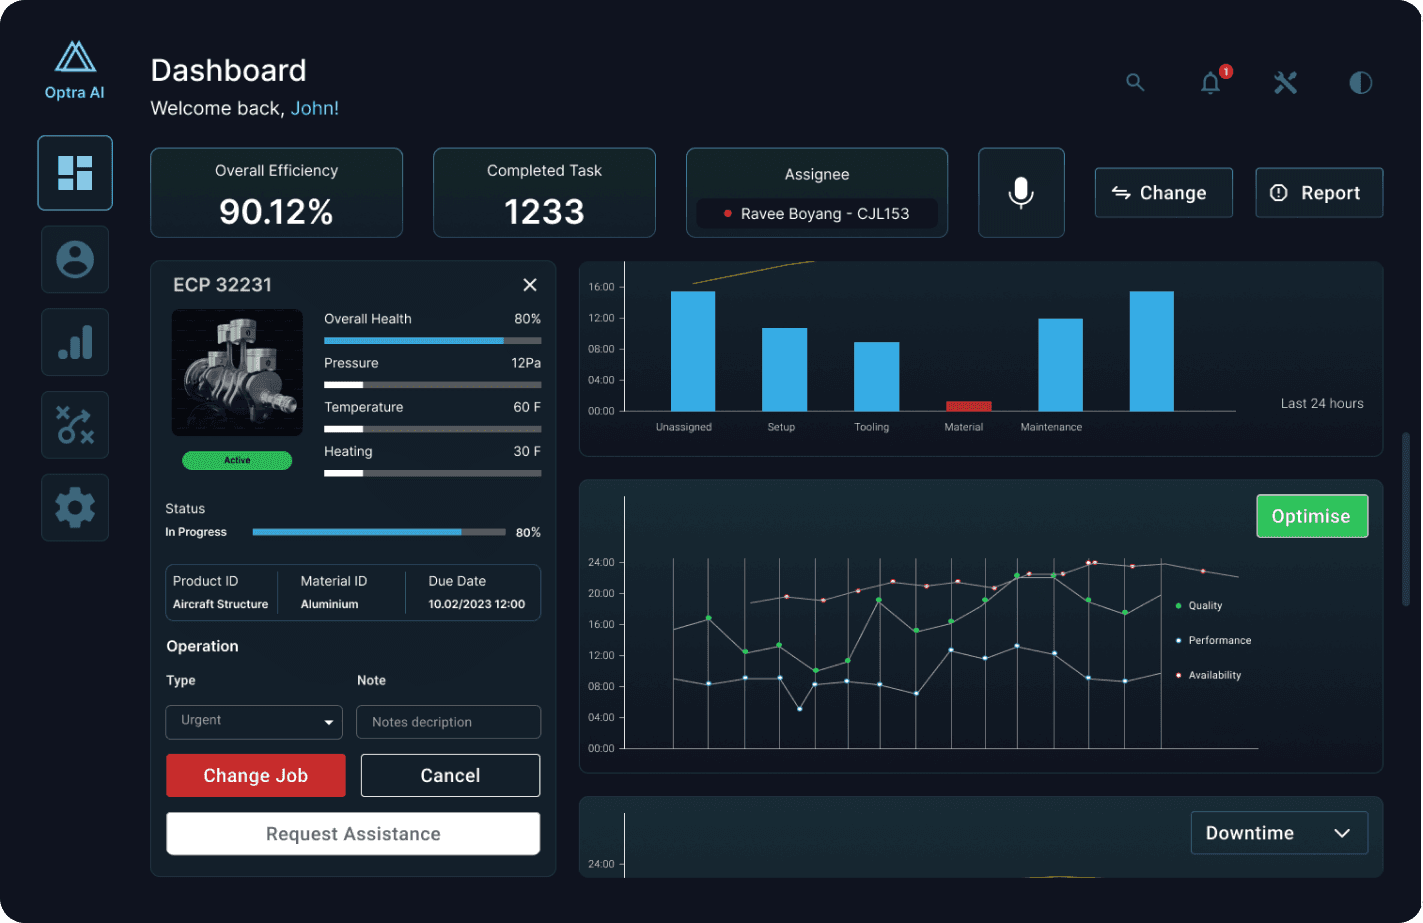
Machine Overview/Analytics
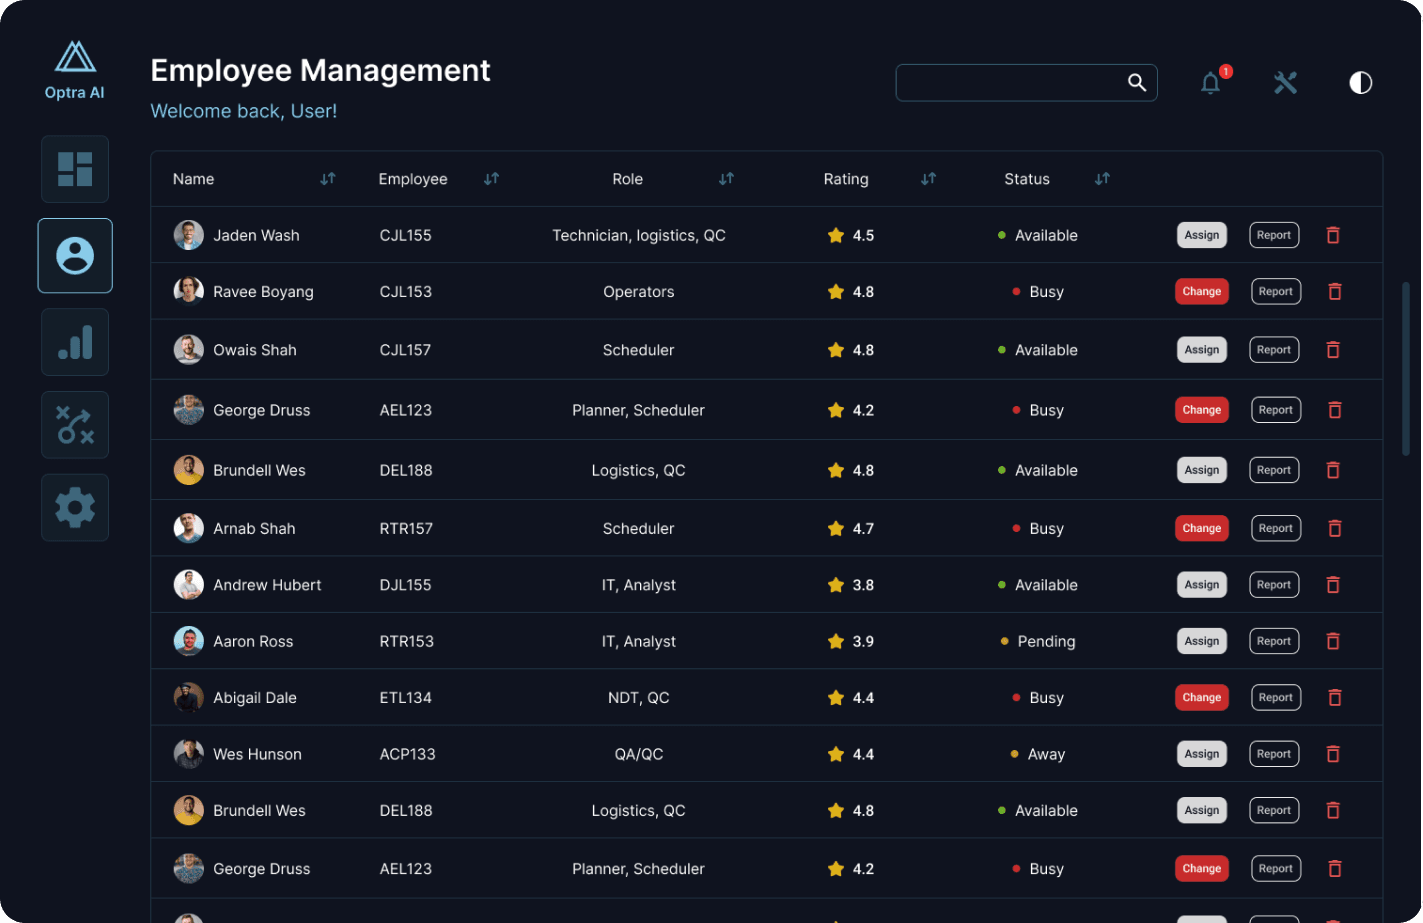
Employee Dashboard
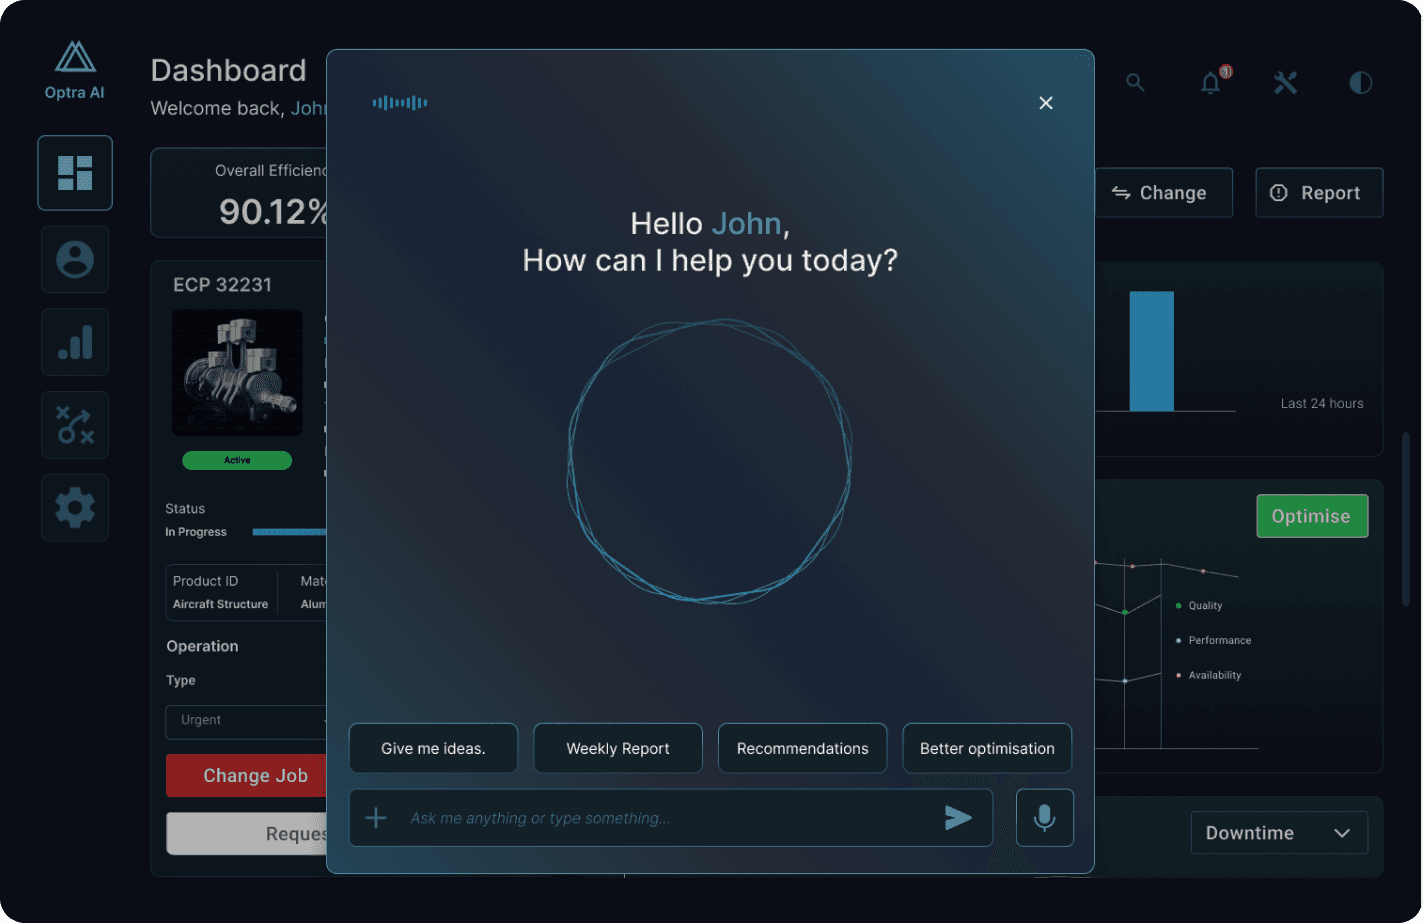
AI Assistant
AI-based recommendations/ Alerts
Prototype
My solution features an interactive, context-aware dashboard that displays real-time machine performance metrics, predictive maintenance alerts, and intelligent worker assignment suggestions based on skill mapping and availability. The interface supports voice commands and gesture-based navigation on a VR device, allowing for hands-free operation in high-mobility environments. The prototype reflects real-world factory scenarios, including fluctuating machine conditions, shift changes, and emergency alerts, enabling usability testing in both normal and high-pressure contexts.
Research Insights
To begin with, for the given problem, trying to understand the underlying problems faced by manufacturing supervisors was key. I conducted in-depth research into current factory floor workflows, decision-making challenges, and the cognitive load associated with multitasking in industrial environments. Below are the results of my findings.
Understanding the Problem:
As data-driven decision-making becomes increasingly essential to business success, manufacturers are under pressure to harness real-time operational insights for continuous improvement. AI-integrated systems present a compelling solution, enabling better-informed decisions through intelligent automation and predictive analytics.
One promising design approach is personalisation or adaptation, where the system learns from individual users and incrementally tailors its interface and interactions. This human–AI collaboration empowers supervisors to make nuanced decisions while leveraging the system’s analytical capabilities.
To optimize usability in dynamic factory environments, especially for floor supervisors, a hands-free interface such as a head-mounted display (HMD) or an optical see-through device becomes a key component of the solution. These devices enable real-time contextual data to be overlaid on the user’s field of vision, allowing for quick action without disrupting ongoing tasks. However, the interaction design must also account for ambient challenges for instance, noisy industrial settings that may compromise voice assistant reliability. A balanced approach that combines visual, tactile, and possibly gesture-based controls alongside voice interaction is crucial to ensure seamless and adaptive user experiences. The system should empower supervisors by providing clarity, control, and confidence in both routine and high-stakes scenarios.
Problem Definition:
AI-integrated system for manufacturing supervisors to efficiently track the functioning of machines and ensure the smooth operation of the plant by assigning workers to jobs based on their expertise to maximise efficiency.
Market Research
With the advent of Industry 4.0, manufacturers are increasingly adopting smart technologies that enable them to track and measure every process across the production floor. Among these technologies, manufacturing dashboards have emerged as vital tools in modern operations management. These visual dashboards offer real-time insights into assembly line performance, resource utilization, machine health, production quality, and workflow efficiency.
For supervisors and managers, these dashboards are not just informative; they are actionable decision-support tools. They provide a consolidated view of operations that helps in quick prioritization, proactive problem-solving, and strategic planning. This real-time visibility supports agile decision-making and encourages a culture of continuous improvement on the shop floor.
As wearable interfaces and immersive technologies evolve, the next step in dashboard innovation lies in contextual, spatial, and adaptive visualizations delivered through AR-enabled headsets or smart glasses, transforming static dashboards into live, situational awareness tools that move with the user.
By integrating AI into a wearable interface, I aim to deliver hands-free, real-time operational insights, predictive alerts, and intelligent worker assignment based on skill mapping. This solution addresses key usability needs such as minimal disruption, intuitive interaction in noisy environments, and rapid decision support, ultimately enhancing plant efficiency, safety, and responsiveness.
The landscape of AI-enabled manufacturing platforms is expanding rapidly. Solutions like Augmentir and Seeq lead with strong native AI capabilities, while platforms like Tulip offer modular, integration-based flexibility. The right choice depends on the level of AI maturity, integration needs, and focus on operator vs machine-level insight.
Design Strategy
In this phase of design, complex research insights were processed into actionable design decisions. It begins with defining clear design principles such as clarity, minimal cognitive load, and hands-free usability that guide all experience decisions.
User Persona
User personas are refined to reflect the specific needs and context of manufacturing supervisors, including their environment, tasks, and pain points.
Customer Journey Mapping
A detailed customer journey map is created to outline critical workflows and highlight where AI assistance can enhance decision-making. The system mapping I followed is a process diagram that helped me comprehend, visualize, and analyze the components, relationships, and dynamics within this complex system. Whether it's dealing with complex organizational structures, AI systems mapping helps us make sense of the interconnected elements that contribute to the overall behavior and performance of the system.
Stage | User Actions | Touchpoints | Pain Points | Opportunities |
|---|---|---|---|---|
Log In + Set up | Supervisor logs in and selects their role | Biometric login, login prompt | Authentication delays | Optimise quick access to dashboards with biometrics |
Monitor Machines | Supervisors check machine status via VR. AI shows live updates | Dashboard, VR Progress boards, AI alerts. | Hard to detect minor efficiencies quickly | AI-powered predictive insights with an alert. Live machine updates and performance analytics. |
Worker Assignment | AI suggests an available worker. Supervisors confirm assignments. | Worker profile database, task assignment UI | Worker availability mismatch | AI multi-worker suggestion system for alternative suggestions. |
Detect & Resolve issues | AI predicts machine -> supervisor gets notified | Notifications and AI-suggested fixes | False alarms or delayed alerts | AI Confidence level indicator to validate predictions. |
AI-Powered Optimisation | Supervisor reviews report to optimise workflows | AI-generated analytics and predictive scheduling | Manual analysis is time-consuming. | Automated AI reports & proactive efficiency suggestions. |
Log out & End shift | System syncs updates/ user logs out | Exit prompt + Auto sync | Data loss due to poor syncing | Cloud-based backup & real time sync |
User Flows
User flows helped me comprehend, visualize, and analyze the components, relationships, and dynamics within this complex system. Whether it's dealing with complex organizational structures, AI systems mapping helps us make sense of the interconnected elements that contribute to the overall behavior and performance of the system.
Information Architecture
Information architecture is structured to prioritize essential data and ensure smooth, contextual delivery through the head-mounted display as a user navigates through the product.
Interaction Strategy Interaction
Strategies are planned around intuitive input methods like voice, eye tracking, or gestures to reduce disruption. System feedback mechanisms are designed to provide real-time alerts and confirmations in a subtle, non-intrusive manner. The strategy also includes preparing for key use scenarios and edge cases, ensuring the system responds gracefully to unexpected events.
Head mount display to supervise the functioning of the manufacturing unit and optimize its resources for more efficiency with less wastage of energy. It is achieved by monitoring the machine in real-time for any defects so it can be replaced by timely human intervention. Machine monitoring uses sensors and IoT devices coupled with predictive analysis to forecast machine failures. Worker performance and skill set data is recorded manually by the supervisors through an audit fed into the system. The human interaction with the head mount display should allow supervisors to access, manipulate, and update machine status, and worker information and also should be able to provide the users recommendations to avoid unmonitored production, production overflow, wastage of resources, and so on. Visual alerts and feedback on the AR display help them to make prompt actions for seamless production.
Machine Management: Machine monitoring to predict failures:
Utility: The automated information regarding the machines gets updated and is stored in the database directly is sent to supervisors for further analysis to make the final decisions upon confirming.
Balance: It should provide the perfect balance between automation and manual operations that needs humans intervention in the process for more efficient management.
Control: The supervisors should have control on accessing the machine-related data at times.The supervisors have control at any point in time to get any machine details and not always want to wait for automation to finish each time.
Worker Management: Identifying and assigning skilled workers to machines
Utility: Provide insights to workers' databases and skillsets to assign machine jobs.
Balance: The Interface should provide supervisors with information that they can assess, manipulate, and take action on.
Control: Supervisors to access, manipulate and update machine status, worker information. Users can also override system decisions anytime.
Production optimization: System Refinement: Real-time updates on machine status and recommendations to manage worker schedules, and optimize production capabilities. This increases the utility by giving users more control over critical decisions.
Human AI teaming Issues:
Human-AI teaming in AR-integrated head-mounted displays offers immense potential for enhancing productivity, safety, and decision-making in this context for manufacturing unit.
However, there could be some challenges associated with it like more cognitive load to the users, trust issues with AI, communication between the human and AI, usability, situational awareness, privacy, adaptability, workflow integration, and performance is essential to realising the full benefits of this technology. Carefully designed, user-centred development, and continuous evaluation of the system are key to overcoming these challenges and ensuring effective human-AI collaboration.
Ensuring Alignment:
Finding a perfect balance between automated operations can ensure alignment. A response system that sends timely feedback to users. As a user, he should always feel a sense of control over the automated system for better alignment which should allow supervisors to access, manipulate, and update machine status, worker information and override any recommendations/suggestions provided by the AI system.
Handling AI Updates:
The users should be informed and provided with necessary training about any AI model updates. If it requires onboarding, users should also be given training or assistance on how to employ these system changes.
Development
Following my initial learnings, wireframes and concept sketches are translated into interactive prototypes that bring the AI-integrated head-mounted display experience to life. The goal is to visualize and validate key workflows such as machine monitoring, task assignment, and real-time alerts through intuitive, context-aware layouts. Prototypes are designed to simulate real-world conditions, factoring in limited screen space, user movement, and environmental constraints on the shop floor. I tested early concepts using low- to mid-fidelity wireframes to quickly gather feedback and iterate on the design.
At the start of the prototype development stage, I considered several critical questions to guide our design decisions. First, I examined the nature of the data processed by the system recognizing that it is high-dimensional, rapidly changing, and often marked by uncertainty due to fluctuating machine performance and variable worker availability. Based on these characteristics, I explored suitable information visualization methods to help users make sense of complex data in real time. Two potential approaches were a heat map overlay and a timeline-based performance dashboard. Heat maps offer an intuitive spatial representation of machine status and worker distribution, making it easy to spot anomalies. Timeline dashboards allow detailed tracking of performance trends and job assignments over time, but risk becoming cluttered in high-velocity environments. In parallel, I addressed the challenge of automation interpretability particularly the issue of supervisors not fully understanding how the AI assigns workers or flags machine issues. This lack of transparency could lead to distrust, misinformed decisions, or even operational delays if not resolved. I plan to evaluate the success of this interpretability layer through usability testing and supervisor feedback, focusing on clarity, trust, and decision confidence during real or simulated tasks.
Nature of the data:
High-dimensional. Dimensions include machine sensor output (pressure, temperature, productivity, quality, operational) and personal data to assign skilled workers to machines which is updated (e.g. availability, worker schedules, skillset and tasks)
Machine Health Data:
Machine Learning and Predictive Analytics use historical and real-time data to predict potential failures and optimize maintenance schedules. AI and machine learning algorithms analyze sensor data to identify patterns that precede equipment failures. Predictive analytics allows for more precise maintenance, reducing unnecessary downtime and extending the lifespan of machinery. There may also be high uncertainty in predictions due to varying operational conditions and sensor inaccuracies.
Worker Availability Data:
Includes real-time updates on worker status, skills, schedules and tasks, This data is less dimensional but changes rapidly due to the dynamic nature of tasks and worker movements. There may be some uncertainty if data from various sources and information entered manually by supervisors may not be always accurate. Various data set give away machine information to predict machine failures on time for replacement. Vibration to check for any misalignments, or imbalances within machine parts, temperature data to prevent overheating of units, to ensure pressure units are within operational range, and Power consumption to check for abnormal consumption patterns. And lastly, use of sensors, cameras, and automated inspection systems to detect defects or deviations in the product quality of heating units. High-dimensional data needs to be interpreted and communicated as actionable insights to the user. There should be a definitive and transparent way to send complex information regarding machine status through timely alerts and feedback. Voice assistant and initiated commands may help the users retrieve and process information much faster to ensure efficient machine control and monitoring.
Information Visualisation Methods
Interactive Visualisation:
This allows users to explore data dynamically and change views or filters to uncover insights.
Users can interact with the visualization (e.g., clicking, hovering, filtering) to explore different aspects of the data.
Positive: Empowers users to drill down into data, customise views, and discover insights that static visuals might not reveal.
Negative: Can be complex to work with due to the data density and might as well require technical skills to operate.
Dashboards:
We are aggregating multiple visualizations to provide an overview of key metrics and data insights. A collection of charts, graphs, and tables displayed on a single interface, often interactive.
Positive: Allows users to monitor multiple data points in real-time, providing a comprehensive view of performance or trends.
Negative: They might demand the required expertise to use them due to complex data loads and patterns.
Interpretability, problems and consequences:
Yes, the above system heavily coupled with data that are driven through automation at various stages will have interpretability issues. The system uses machine learning algorithms to analyse sensor data to identify patterns that precede equipment failures which might be difficult for users to grasp. As result they might start to overlook the operations also start losing trust in the AI system. It is very essential to provide these alerts and feedbacks in simpler formats for users to understand for them to act on. If this is unattended, this could lead to poor decision making and wastage of resources which would lead to inefficient manufacturing.
Evaluation Techniques: Methods to improve interpretability
AR glasses can provide them with directed instructions on what leads to a machine's failures, or the reasons when a machine is about to fail at normal circumstances.
- Constant surveys/feedback from the users(supervisors) can help the automated system to provide users with more informed choices and recommendations. Assessing their understanding of how the system comes up with certain decision and communicating the same back to the system will improve its functioning significantly.
Wireframing
Undertook the redesign of core app screens and user flows, addressing the audit's findings. Emphasized the creation of a more intuitive and goal-oriented user journey, reducing cognitive load and enhancing the overall user experience.
Design Execution
Designed and developed this interface with a focus on clarity, immediacy, and contextual awareness, essential for supervisors operating in fast-paced industrial environments. Adopted a functional color scheme using high-contrast, safety-compliant colors to differentiate critical alerts from routine updates, enhancing quick comprehension under varying lighting conditions.
Typography and iconography were carefully chosen for legibility and recognizability, even in motion or when viewed through a head-mounted display. Dynamic visual cues and motion principles were subtly applied to guide attention without distracting from core tasks ensuring the interface is not only visually coherent but also operationally efficient and ergonomically aligned with the realities of the factory floor.
Typography
Colour
Iconography
Accessibility Consideration:
Accessibility is key to ensuring readability, usability, and visual comfort in different lighting conditions. Hence, I considered a dark/ light theme toggle for the users as it involves an enormous amount of data
Contrast and Readability
WCAG recommends 4.5: 1 contrast for body text & 3:1 for large textColour Consistency
For better readability and reduced strain used #F5F5F5 for the Light theme
For better readability and reduced strain used ##182B35 for the Dark themeIcons / UI Elements
Used a dual tone that changed based on themes
For previews/alerts, prompts used subtle shadows to feel better separations
High-fidelity Prototypes
Developed high-fidelity prototypes in Figma to simulate the interactive experience of the AI-integrated system within a manufacturing environment. The prototypes were designed with a clean, data-focused interface, optimized for hands-free, glanceable interaction on head-mounted displays.
Plant Dashboard
Machine Overview/Analytics
Employee Dashboard
AI Assistant
AI-based recommendations/ Alerts
Prototype
My solution features an interactive, context-aware dashboard that displays real-time machine performance metrics, predictive maintenance alerts, and intelligent worker assignment suggestions based on skill mapping and availability. The interface supports voice commands and gesture-based navigation on a VR device, allowing for hands-free operation in high-mobility environments. The prototype reflects real-world factory scenarios, including fluctuating machine conditions, shift changes, and emergency alerts, enabling usability testing in both normal and high-pressure contexts.


Usabilty & Refinement
UX success metrics such as task completion time, error rate, and supervisor satisfaction are defined and integrated into usability testing plans to ensure the solution is both practical and impactful. This stage bridges vision and function, helping us refine the experience before moving to full-scale development.
Facilitated user testing with a diverse group of app users, gathering insightful feedback on the redesign. This phase was crucial in identifying unforeseen usability issues and validating the effectiveness of the new design elements. Iterative refinements were made based on this feedback, fine-tuning the app's interface to maximize user satisfaction and engagement.
System boundary:
The power supply to run the device
Internet connectivity is required to load data in real-time.
Real-time machine and worker data are available to the system.
Sensors and IoT devices for monitoring machines.
The interface that the supervisor uses to view machine status, machine information, worker status, and worker availability.
Hardware that supports the display in performing tasks.
Software that runs the application to track machine health and worker status
An algorithm that processes the data gathered from the sensors to an integrated head mount device for providing recommendations and predictive insights.
Feedback in the form alerts for supervisors to take calls promptly.
Instructions from supervisors to workers based on the data to assign machine jobs.
Safety regulations and standards in a manufacturing plant.
Risk Assessment Method: SWIFT Analysis
SWIFT analysis offers great help in comprehensive risk identification, improved decision-making, enhanced communication, and cost efficiency. It helps organizations anticipate and mitigate risks, ultimately enhancing their resilience and ability to achieve strategic objectives.

Verification-Cross Metrics
Deployed Verification cross metrics to ensure all requirements are fully addressed particularly helpful when handling such a complex manufacturing problem integrated with AI

Learning Outcomes
Clear understanding of how to approach a design problem integrated with AI
Define a problem and a requirement specification for a human-AI system
Design a function model of a human AI system using function structure and a FAST diagram
Describe and apply an automation strategy to the defined functional model of a human AI system
Articulate the primary and secondary criteria in automation analysis
Suggest an interaction strategy for human-AI systems
Understanding the importance of interpretability in human-AI systems
Evaluation of risk induced by the human-AI system
Strategies to evaluate a human AI system before and after deployment


Other projects

Aloha Cloud POS
Shaping next generations POS experiences

Quick Commerce with AI assistant - Case Study
AI shopping assistant to support customer purchases online for quick commerce platform to efficiently give suggestions and recommendations for users to make more informed and faster decisions.

Designer's Workspace
Reimagining Designer's workspace through ergonomic lens
